- +27 12 644 0300
- +44 1234 834920
- This email address is being protected from spambots. You need JavaScript enabled to view it.
Printing
Where Are My Plot Styles?


- Category: Printing
- Tuesday, 03 July 2012 13:40
Applies to
Caddie 10 and higher
Question
Where are my plot styles?
Answer
Plot styles in a Caddie DWG (or any Caddie drawing type) are stored as individual files (yourname.ctb) in a plotstyle folder. Also when in the Caddie plotstyle manager (MENU>FILE>CONFIGURE PLOTSYLES) copying, creating or renaning plotstyles will use the desiganated folder.
The actual place where this is will depend the version of your Caddie or your operating system or your choosen location (see below).
Prior to Caddie 16
The default plotstyle folder is in the installed Caddie folder and is called “Ploltstyes”.
From Caddie 16
The folder structure changed and the new position for this folder moved and the location will depend on the operating system.
To make it easy to find the default folders an option was added to the Caddie menu which will take you directly there.
To access this do the following:
MENU>UTILITIES>BROWSE>COMMON APPLICATION DATA FOLDER
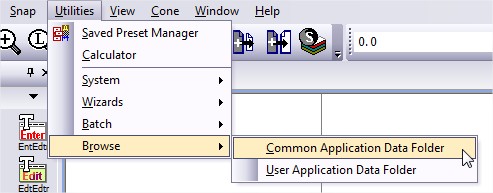
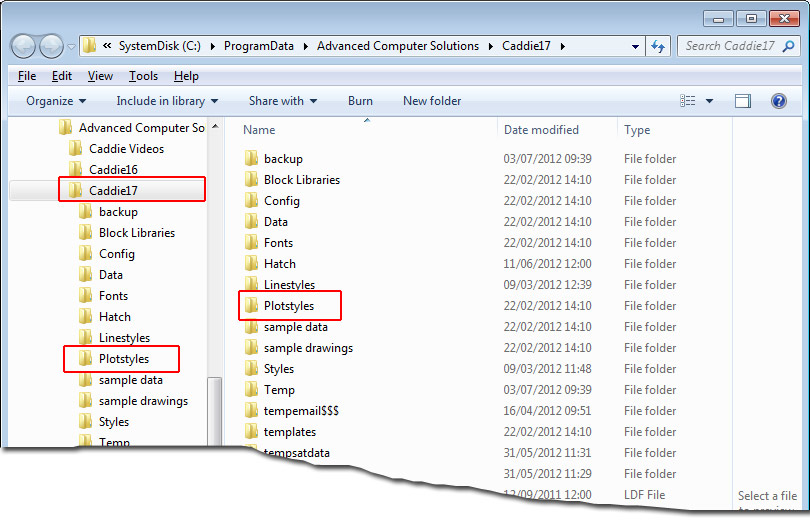
This opens the common folder in a new Windows Explorer window. There you will see the plotstyle folder. Open this folder and drag and drop, paste a copied plotstyle file or note the folder path for the future.
You can also use the Windows search function to search for "plotstyles" or "*.plt" (without quotes) on the C: drive etc. and that will find the correct folder.
Changing the Location of the Plotstyle Folder
If you want to change the folder to a different location, make sure the new location has the required privileges to read and write.
Go to MENU>SETTINGS>ENVIRONMENT SETTINGS>FOLDERS>PLOTSTYLES
Expand the folder and double click the folder path
Select a new path and OK.
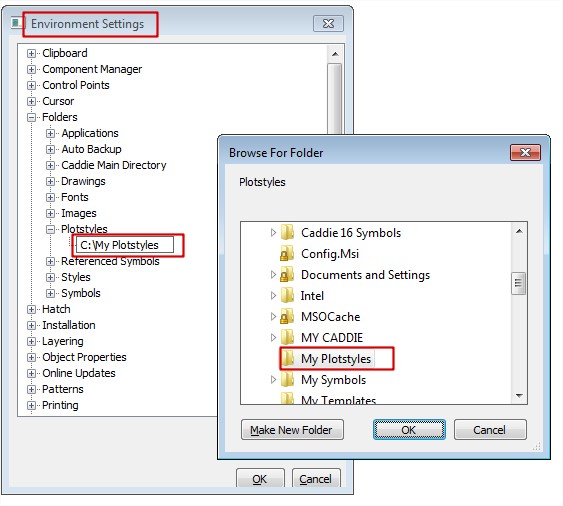
The new path has been selected.
The method mentioned above, used to find the default folder, will still show the Caddie default folder and not your custom folder.
To find where that is at any time, use the same method as when changing the folder. This will show the path which you can then use Windows Explorer to find.,
This method can also be used to find the current location of the plotstyle folder.
Specifying Plot Line Widths
- Category: Printing
- Friday, 23 July 2010 17:11
How to Specify a Line Plot Width
There are basically two ways to specify a Line width in a DWG drawing (Caddie).
- Defining it in a Plotstyle
- Using the Object Pen Width
Using a Plot Style
The first is to use a plotstyle and to specifically say, that at the time of printing what the thickness of the line should be. The pens used to draw (a line for instance) are chosen from the pen select dropdown (255 available pens plus ‘By Layer’ and ‘By Block’). For more detail on using ‘By Layer’ and ‘By Block’ (see the 'Creating Variable Pen Widths' FAQ for further information). The colour of the pen on the screen is use to represent the pen chosen. At the time of printing (plotting), a plot style file is used to translate the object pens (the screen pens) to a plot thickness and plot colour. These plot styles are saved in the Plotstyle folder.
You can find the current path to this folder by looking at
‘MENU | SETTINGS | ENVIRONMENT SETTINGS | PLOTSTYLES’
The path to your own plotstyle folder can also be set here.
The plotstyle that is used for a particular sheet is set by the sheet setup command (‘CADDIE | SHEETS | SHEET SET’). The plotstyle used by viewports defaults to the same as the sheet, but can be set to a different one by doing an ‘Object Properties’ on the viewport and slecting a different plotstyle.
Editing a Plotsyle
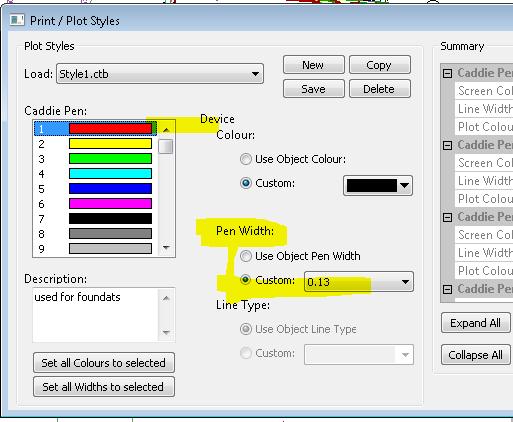
To edit a plotstyle use ‘MENU | FILE | CONFIGURE PLOTSTYLES’. The plotstyle that is set for the current sheet (or model) will be the one shown as loaded. If you require to edit another style select it from the ‘LOAD’ dropdown.
In the illustration below, pen one is directly assigned a custom thickness of 0.13. So regardless of any other settings, the line width will be 0.13mm.
Note: polylines also have a property called ‘constant width’. The default value of constant width is set to ‘0’ and therefore when plotted the line width will be that of the plotstyle. If the constant width is greater than ‘0’ the greater width will be the one plotted.
In theory every pen could have a ‘Custom’ width set in the plotstyle but usually only those required for a pre-set size will be assigned. All others are normally set as ‘Object’ Widths. Object widths are those set directly on the screen. See below and the FAQ
The same dialogue also allows the setting of the colour of the plotted pen.
The choice is
| Object Pen Colour | Set the colour of the Plotted Pen the same as the current screen pen (Object Pen) |
| Custom | Sets the pen from the drop down colour palette |
Again only those required for a pre-set will be set to ‘Custom’ all others are normally set as ‘Object Colour’.
Setting Lines Widths to a Custom Width
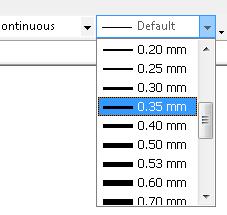
The other way set the line widths is to indicate the lines on the screen by using the pen thickness dropdown.
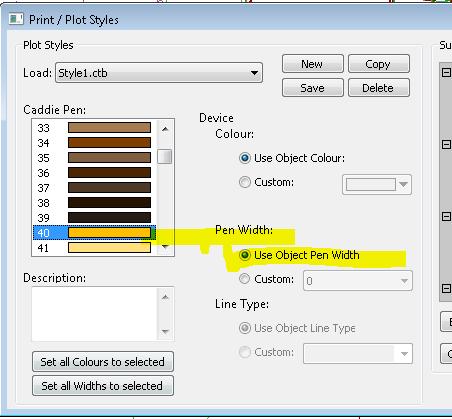
For example, if a line is drawn using Pen 40, intstead of rellying on setting the thickness in the plot style, the thickness can be specified at the time of drawing. In the case 0.35mm is used. Another line could be drawn, also using pen 40, but the width is changed to – say – 2.5mm.
As long as the pen (in this case 40 or 63 hasn’t been pre-set in the plotstyle (it is set as Object Pen Width) you will get a plotted line with a thickness of the object thickness.
If it is required to display these widths on the screen the display widths need to be turned on from the status bar.
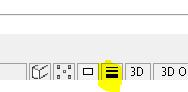 |
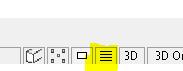 |
| Visibility ON | Visibility OFF |
Use the default object pen width of ‘DEFAULT’ when not specifying the widths on the screen. This may be set directly or ‘BYLAYER’.
How can I stop Opaque borders printing?
- Category: Printing
- Wednesday, 12 May 2010 12:47
By default borders of Opaques show on screen and print. This is a property of the drawing and can be controlled using the following command:
Settings->Drawing Settings->Opaques-> Show boundary->Set to No.
If you are using a template and you set this property to 'No' in the template, then all drawings created based on that template will inherit that setting.
Drawings with gradient hatches do not print properly to pdf printers
- Category: Printing
- Thursday, 08 April 2010 18:18
There is a well documented PDF problem that effects many Windows programs with regard to the way PDF’s handle ‘Vertices’. You don’t need to know what the are except the gradient hatches, in Caddie, which are described by the OpenGL commands, can have a lot of vertices.
When creating PDF’s you may need to change the settings in you PDF writers preferences.
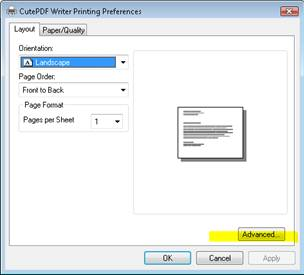
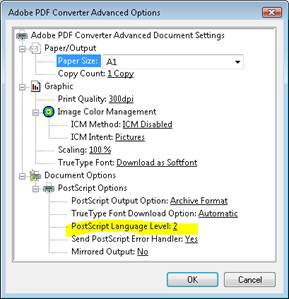
To do this open up the preference dialogue by right clicking your printer. All printers have different dialogues including PDF writers. You need to look for an ADVANCED button (as shown in a CUTEPDF preferences dialogue) and you will get a dialogue similar to the one shown below. In the POSTSCRIPT OPTIONS section look for the Postscript Level and change it from 3 to 2. You only need to do this once. Setting it to PS Level 2 shouldn’t effect any other programmes use of this driver, but if it does then temporally set it back to L3.
If Level 2 doesn't work for you try Level 1
How can I print a rendered Vio Image?
- Category: Printing
- Monday, 22 March 2010 19:00
Creating a Variable Custom Pen Thickness
- Category: Printing
- Friday, 09 April 2010 12:54
We are always being asked how to create a ‘Boundary’ or ‘Special’ pen.
One way would be to pre-assign a number of pens in the plot style file, specifically for this purpose.
It is quite common to have, say the first 8 or 9 pens, set to progressively thicker lines, with a custom pen colour of, say ‘Black’, There may also be a second set of pen (say 11 to 18) with the units are that same for each thickness as 1-9), but all with a colour of,say, ‘Mid Grey’. These can then be used for any secondary detail such as line hatches, or existing or other building detail.
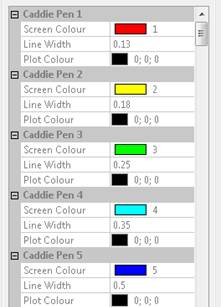
First 5 Pens
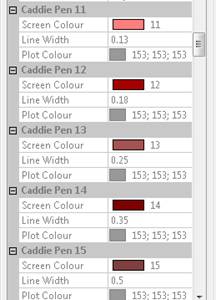
A Set of Grey Pens
If you want sets of extra colours such as red, green an blue, for boundary lines etc., you soon start to eat into the remaining 255 pens. This reduces the number of pens that can be set as ‘Object Colour’, which you may want to use for hatch etc. Not only that, you will have a lot more pen numbers to remember.
A way around this, for these ‘little used pens’, is to have three pens (80, 160 & 240 as an example) set in the plot style. These are set with a custom colour of GREEN, BLUE and RED respectfully and thickness set to ‘OBJECT’
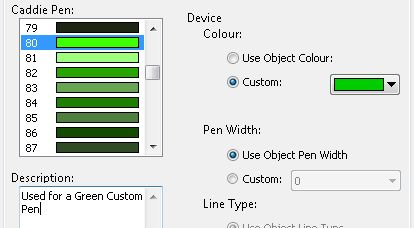
Settings for a Green Custom Pen
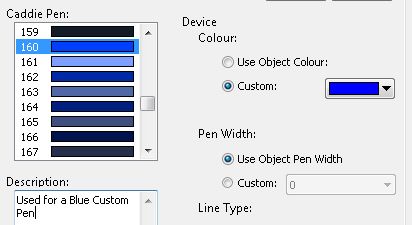
Settings for a BlueCustom Pen
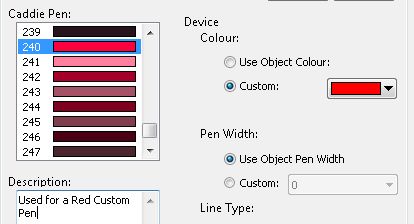
Settings for a Red Custom Pen
As a note, the maximum pen thickness that can be set is 2.11mm. There are a number of solutions to creating thicker lines.
- The first is, simply, to draw parallel lines with an offset of just under the current thickness. This howe ver makes editing any changes more complicated but this can be done with lines, arcs and polylines etc.
- A better solution is to draw with polylines. Polylines can have an additional properties, one of which is ‘Constant Width’. To change this width, select the polyline. Using ‘object properties’ change the width to the required thickness
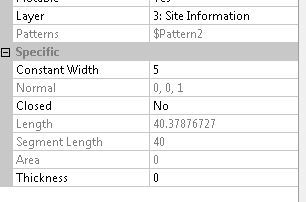 .
.- To change the width of an individual segments, start and end width, use the ‘CADDIE | MODIFY | MODPOL’ command.
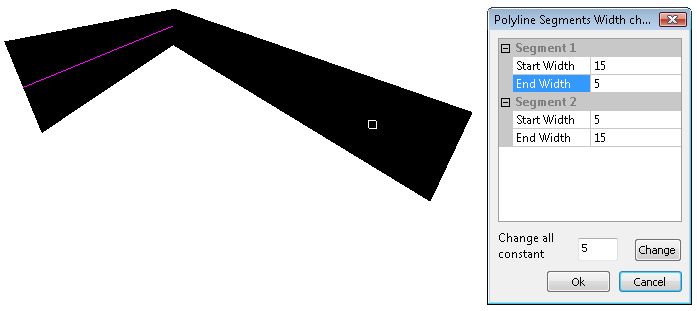
Selecting 'CHANGE' will change all segments to a constant, specified width, which is the same as using object properties.
Another polyline property that can be set in ‘Object Properties’ is ‘Thickness’ and this gives a thickness in the Z axis. This is not, normally, used for 2D drawing.
NOTE: When editing a polyline using the 'CADDIE | MODIFY | POLYLINE' commands, such as 'Insert Node', any existing thickness will revert to '0'